DappLooker Docs
  • 👋Welcome
  • Data APIs for AI
    • Overview
    • Changelog
    • API Authentication
    • API Endpoints
      • GET: Crypto Token Market Data
      • GET: List of All Tokens
      • GET: Multi-Timeframe Technical Analysis
      • GET: Agent Details
      • POST: AI-Powered Query via NLQ
    • Best Practices
    • Conclusion
  • DappLooker Analytics
    • 🗃️Products
      • 📶Analytics
        • 🔎Browse and Search data
        • 📈Creating Charts
          • No-Code Charts
          • SQL Charts
        • 🔢Custom Values
        • 📊Dashboards
          • Create Dashboard
          • Add Charts to Dashboard
          • Discover Page
          • Link dashboard to another dashboard
          • Adding Filters to Dashboard
            • Time Filter
        • ♻️Convert No-Code to SQL
        • 🔗Making Charts and Dashboards Public
      • 🔍Subgraph Analyzer
      • ✨AI Studio
        • AI Studio API Support
      • 🤖DataBOT
        • 🎮Discord Bot
        • ▶️Telegram Bot
        • 🌐Connect with Leading Networks and dApps
      • 🔑DappLooker SDK
        • 🔎Tracking API Usage
    • 🌐Supported Networks
      • Blockchain Data
      • Smart Contracts
      • Subgraphs
      • SubQuery
      • Offchain Data Sources
    • 📲Registering Data
      • My Dashboard Overview
      • Smart Contracts
      • Subgraph
      • Subquery
      • Off-Chain Integration
    • 🔖Featured Projects
    • 🎯Features
      • XRay Feature
      • Filtering
      • Summarize
      • Downloading
        • Download Chart Data
      • Editor Panel
        • Preview Chart
        • Joining Data
        • Types Of Join Data
        • Sorting
        • Row Limit
        • Convert to models
        • Duplicate a Chart
        • New Collection
      • Creating Custom Column and Custom Expressions
      • 📷Screenshot
      • 🗃️Collections
        • Browse Collection
        • Personal Collection
        • Team Collection
    • ⛓️Smart Contract Live Query
    • 🔔Push Notifications
      • 👀Where to view notifications?
      • 📰Push x MetaMask Snaps
    • 👨‍⚖️Case Studies
      • 1️⃣Community Updates
      • 2️⃣DeFi Reports
      • 3️⃣On-Chain & Off-Chain Analysis
      • 4️⃣User Retention Analysis
      • 5️⃣DappLooker Telegram Bot
      • 6️⃣Subgraph Powered No-Code Dashboards
      • 7️⃣API Use Case: Beamswap
      • 8️⃣Embedding Use Case: GRTDataHub
    • 💰Pricing
      • Pricing Breakdown
      • Discounts And Payments
    • 💻Deploy a subgraph on the DappLooker custom node
    • 🥷DappLooker No-code Ninjas Program!
    • 🤝Sponsor With Us
    • 🔗Relevant Resources
    • ☎️Contact Us
  • API Guides
    • Get API Key
    • How to Get an API of a Chart
    • Render Chart or Dashboard as an Image with API
    • Mintbase
      • Individual Store Level APIs
      • Mintbase Protocol Level APIs
    • Nordek Developer APIs
  • Explorers
    • CeloSpy
    • VaraSpy
Powered by GitBook
On this page

Was this helpful?

  1. DappLooker Analytics
  2. Case Studies

DeFi Reports

PreviousCommunity UpdatesNextOn-Chain & Off-Chain Analysis

Last updated 1 year ago

Was this helpful?

Impact Market is a non-profit organization that provides microcredit loans to entrepreneurs in developing countries. They use DappLooker dashboards to track the progress of their microcredit program and to measure the impact of their loans.

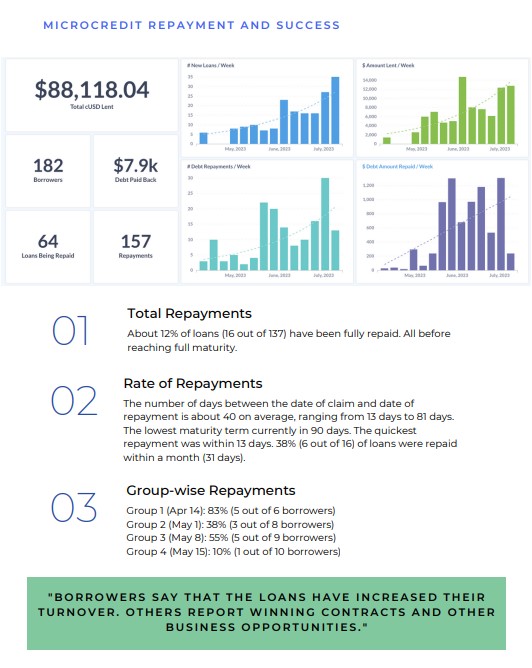
The dashboard shown in the image tracks the following metrics:

  • Total number of loans issued

  • Number of loans repaid

  • Rate of repayment

  • Average number of days between claim and repayment

  • Group-wise repayments

The dashboard is used by Impact Market to track the progress of the microcredit program and to identify areas where they can improve. The dashboard is also used by donors to track the impact of their donations.

The dashboard is a valuable tool for Impact Market because it provides them with a clear view of the progress of their microcredit program and the impact of their loans. The dashboard also helps them to identify areas where they can improve their program.

Here are some of the benefits of using DappLooker dashboards in your organization reports:

  • Enhanced Performance Tracking: Dashboards offer a comprehensive view of key performance indicators, allowing your organization to track progress and impact across various initiatives. Whether it's monitoring project milestones, evaluating customer satisfaction, or measuring sales growth, these visual representations provide valuable insights into the overall performance of your organization.

  • Informed Decision-Making: With DappLooker dashboards, your organization gains access to real-time data and analytics, empowering decision-makers with accurate information. Identifying trends, patterns, and potential issues becomes more efficient, enabling timely decision-making to respond to opportunities or challenges promptly.

  • Communicate with stakeholders: Dashboards can be used to communicate with stakeholders. Dashboards can be used to show in official reports the progress of your organization and the impact of your organization's loans.

Overall, DappLooker dashboards are a valuable tool for your organizations and an efficient way to communicate with their stakeholders providing them with stunning visualizations.

👨‍⚖️
2️⃣
https://dapplooker.com/dashboard/im-microcredit-public-504